Many nonprofits are working on annual reports right now. That makes this a good moment to think about how you show your work year-round. Because your annual report content shouldn’t live in a PDF and disappear—you can (and should!) reuse the content to show impact on your website all year long.When nonprofits talk about impact online, they usually default to one of two approaches (sometimes based on which one feels less painful to write):
- Stories, because they’re emotional and human
- Statistics, because they feel credible and concrete
Either is better than nothing, but neither is as effective on its own. The strongest approach combines both.A real human story paired with clear, relevant data creates what we can call an “impact story”. (Not a formal term, just a useful one!) It shows both who you serve and what actually changes because your organization exists. It gives visitors something to connect with emotionally, while also answering the practical questions they’re asking themselves: Is this work meaningful? Does it really work?
What makes an impact story impactful?
A strong impact story doesn’t need to be long or dramatic, just thoughtful and respectful. Think about including:
- One person’s story, with just enough detail to build empathy. Make sure, of course, that you’re getting consent and protecting privacy.
- The challenge they were facing, described with dignity. Of course, never turn hardship into spectacle or frame someone as defined solely by their challenges.
- A photo, when possible. If it’s tricky to get a real photo, stock photos can be surprisingly useful. Join our webinar tomorrow (Wednesday) to learn more!
- A small set of impact stats that show scale or results.
Example: The Bail Project
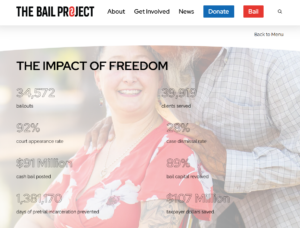
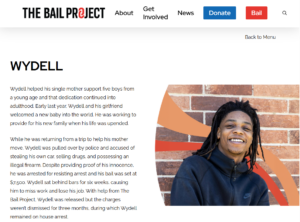
In its annual report, The Bail Project includes a page called “The Impact of Freedom,” which starts with statistics showing the scale of its work. Those numbers are followed by five individual client stories, including Wydell’s.The numbers establish credibility. The story adds humanity. Together, they make it clear this work isn’t a one-time success, but something the organization does consistently and meaningfully.
Example: Virginia Poverty Law Center
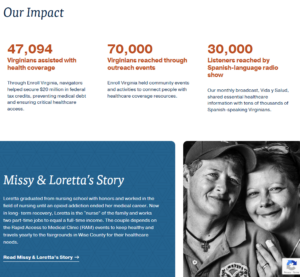
The Virginia Poverty Law Center takes a similar approach across many of its program pages. On its Health Coverage and Access page, for instance, a real-life story about how someone experiences poverty appears alongside statistics showing how many Virginians the organization has helped.The stories help visitors understand what these issues look like day to day. The numbers show how widespread the problem is, and how the organization is responding at scale. Together, they make the impact easier to grasp and easier to trust.
Infusing Data Into Your Impact Stories | Carnegie Investment Group
A similar approach to linking data to stories, but with more detail about finding and defining the statistics.
Bond’s ethical storytelling guidelines | Bond
Any stories you tell should be rooted in ethical storytelling guidelines, and this guide is the OG set of guidelines that most others are based on. It’s a big document (about 40 pages) but is a critical read for all nonprofit communicators.
Book: Switch: How to Change Things When Change Is Hard | Chip and Dan Heath
I didn’t even realize it until I was halfway through writing this tip, but this idea of linking statistics (“the head”) with stories (“the heart”) is one of the core ideas in this classic book about how to make change. Including, for instance, how to change someone into a first-time donor. It’s an easy but very useful and inspiring read.
Read the latest